Free Excel KPI Procurement Template: 7 Essential Metrics
- Introduction
- What Makes This Excel KPI Procurement Template Different
- 7 KPI Sheets Included in the Report
- The 7 KPI Metrics Calculated Automatically
- Why Python Powers This Excel KPI Procurement Template
- Who Should Use This Template
- Download the Free Excel KPI Procurement Template
- Explore the Full KPI Procurement Series
- Final Thoughts
- Further Reading
Article contents
- Introduction
- What Makes This Excel KPI Procurement Template Different
- 7 KPI Sheets Included in the Report
- The 7 KPI Metrics Calculated Automatically
- Why Python Powers This Excel KPI Procurement Template
- Who Should Use This Template
- Download the Free Excel KPI Procurement Template
- Explore the Full KPI Procurement Series
- Final Thoughts
- Further Reading
Introduction
Measuring procurement performance should be straightforward — yet in practice, most teams end up with spreadsheets full of broken formulas, scattered data and reports that take hours to update. A proper Excel KPI procurement template should do the heavy lifting for you, not add to the workload. This one does exactly that.
This template is built on a Python script that simulates a realistic procurement scenario — the kind you would find in a manufacturing or services company. It generates a complete Excel report automatically, with dashboards, charts and fully interactive pivot tables. Excel remains the familiar output; Python is the engine that makes everything robust, scalable and easy to maintain over time.
What Makes This Excel KPI Procurement Template Different
This is not a standard spreadsheet with a couple of formulas and a static bar chart. The underlying dataset includes 200 realistic purchase orders, suppliers with varying performance tiers (A, B and C), delivery delays, defect incidents, lead time variations and multiple spend categories. These are not artificially tidy numbers — they reflect the kind of messy, real-world situations you encounter when you start measuring procurement performance seriously.
The goal is to give you a base that feels credible from day one, so you can explore the analysis, adapt the logic and apply it directly to your own data without having to invent plausible scenarios from scratch.
7 KPI Sheets Included in the Report
KPI Dashboard
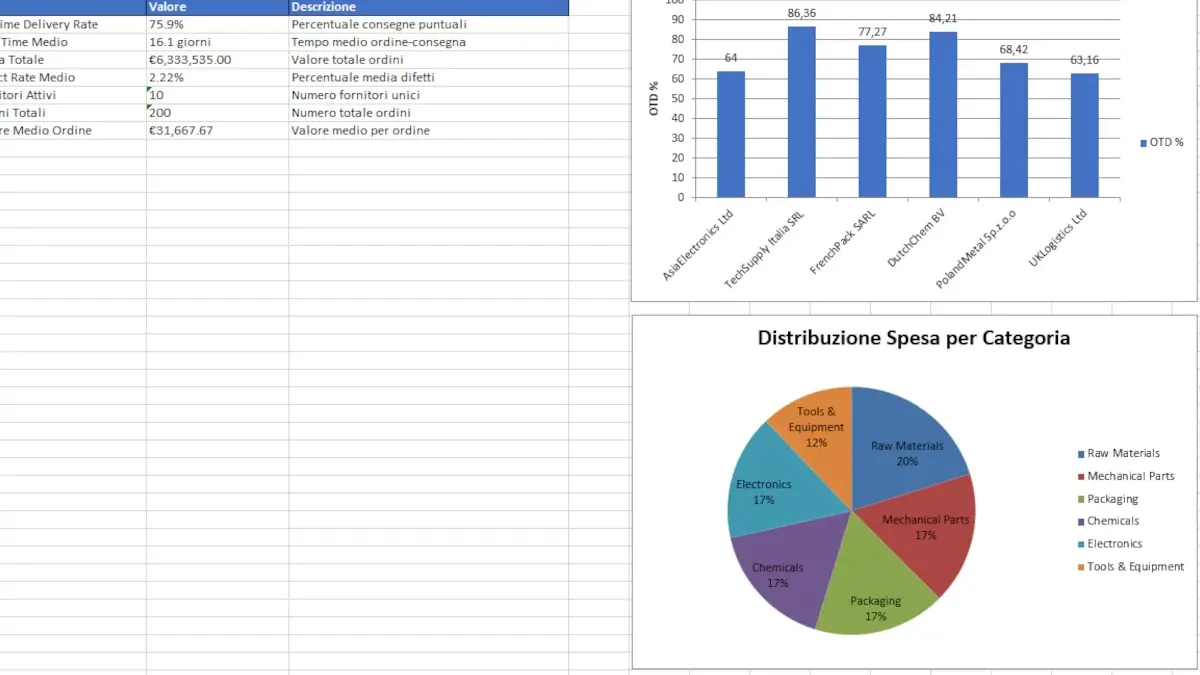
The main dashboard provides a consolidated view of the indicators that matter most in any procurement operation. At a glance, you can see On-Time Delivery Rate (OTD), average lead time, total spend, defect rate, number of active suppliers and average order value. It is designed to be the first sheet you open whenever you need to assess overall performance quickly.
Supplier Performance Analysis
This sheet breaks down each supplier’s results across five dimensions: number of orders, total spend, OTD percentage, average lead time and defect rate. Charts make it easy to compare suppliers side by side and identify who is consistently delivering and who is creating problems downstream. This is the same approach used when conducting a structured Excel KPI procurement review with category managers or leadership teams.
👉 For a deeper dive into supplier metrics, see: Supplier KPIs: the most used metrics and how to apply them
Category Spend Analysis
Where is your budget actually going? This sheet answers that question with total spend by category, percentage breakdown, order counts, and both bar and pie charts. It is the foundation for any meaningful spend analysis exercise and a useful starting point before supplier negotiations or sourcing decisions.
Advanced Charts and Visual Dashboards
The template generates bar charts for supplier comparison, pie charts for spend distribution and combined charts plotting Lead Time against OTD percentage. All visuals are built automatically — they update with the data and are ready to drop into a presentation without further editing.
Native Excel Pivot Tables
One of the strongest features of this KPI procurement template is that it includes genuine Excel pivot tables, not simulated ones. You can filter by supplier, analyse by category, review monthly trends and rearrange fields freely. It behaves exactly as you would expect from a natively built Excel file — because that is precisely what it is, generated automatically by the Python script.
The 7 KPI Metrics Calculated Automatically
The report includes the procurement KPIs most commonly tracked by buying teams and supply chain analysts.
- On-Time Delivery Rate (OTD): the percentage of orders delivered on or before the agreed date. Read the full guide on OTD KPI
- Average Lead Time: the elapsed time between order placement and delivery. Read the Lead Time KPI article
- Supplier Performance Score: a composite rating based on punctuality, quality and cost consistency.
- Defect Rate: the average percentage of defective or non-conforming items received.
- Spend Analysis: a breakdown of expenditure by category and supplier, ready for strategic review.
Why Python Powers This Excel KPI Procurement Template
This is a question that comes up often, and the answer is entirely practical. Python generates updated reports in seconds — no copy-pasting, no broken formula chains, no manual chart rebuilds. When your purchase order volume doubles, the script scales with it without any structural changes. The code is open, commented and straightforward to customise: you can add new KPIs, change chart types or adapt the logic to your specific procurement context.
Excel remains the output format your stakeholders know and trust. Python simply removes its structural limitations, making the Excel KPI procurement workflow faster, more reliable and genuinely repeatable.
Who Should Use This Template
This template is built for procurement buyers, purchasing managers, supply chain analysts and anyone looking to move from manual reporting towards a more structured, data-driven approach. If you work regularly with supplier data, order volumes and performance KPIs, this gives you a solid, ready-to-use foundation — one you can adapt rather than build from the ground up.
Download the Free Excel KPI Procurement Template
Excel KPI Procurement Template
The ZIP file contains: a full Excel report with interactive dashboards and native pivot tables, a realistic sample dataset and an optional Python script to automatically regenerate KPIs, charts and analysis. All files are free and open source — use them, modify them and adapt them to your needs.
Explore the Full KPI Procurement Series
If this template is useful, the following articles cover each component in depth with practical examples and real-world scenarios.
- How KPIs are transforming procurement and supply chain
- OTD KPI: how to measure On-Time Delivery
- Lead Time KPI: definition, formula and worked examples
- Supplier KPIs: the most used metrics and how to apply them
- Interactive Supply Chain KPI Dashboard
Final Thoughts
In procurement, numbers alone are never enough. What makes the difference is how you structure them, how you read them and how consistently you translate them into decisions. This Excel KPI procurement template was built with that purpose in mind — to give you a tool that is immediately usable, analytically sound and easy to evolve as your needs change.
This template covers the main operational KPIs. To understand how to read and connect them, check the complete procurement KPI guide.
Further Reading
- ISO 9001 – Quality Management Systems: the internationally recognised standard for quality management, useful for understanding how procurement and supply chain KPIs integrate into broader quality frameworks.
Share this article